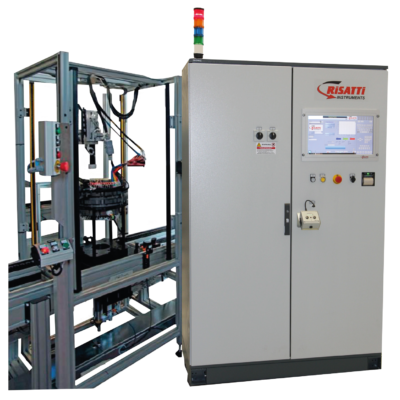
The new partial discharge detector developed by Risatti it’s equipped with sensor consisting of a current transformer, connected to an active I/V converter with a bandwidth greater than 20 MHz. The new sensor and its drivers are designed to be integrated into the H and P1 series.
Partial discharge detector – Risatti’s approach
The new sensor developed by Risatti consists of a current transformer connected to an active I/V converter with a bandwidth greater than 20 MHz. It allows, together with the SW module management, the measurement of partial discharge levels, in compliance with IEC 60270 standard: the method of insertion in the HV circuit can be chosen among those recommended by the standard. In particular, we recommend the configuration that sees the CD placed in load series, cold side.
Digitalization
Digitization can be performed by any device able to sample at 100MS (or higher), while the number of samples required is not binding, although it is preferable to have a device with adequate memory depth.
The implemented algorithms allow the creation of virtually infinite size buffers, and the acquisition time is always set according to the required time to transfer data.
The new sensor and its drivers are designed to be integrated into the H and P1 series.
Measured without added SW filters, the bandwidth is, with a good linear approximation, between 10 khz and 20 MHz. At 1000 Hz the attenuation is higher than -25dB, which represents the typical octave rolloff.
This data confirms its possible use in the detection of micro discharge during the implementation of the test voltage, without having to resort to complex HW and/or SW filtering operations.
The system consists of:
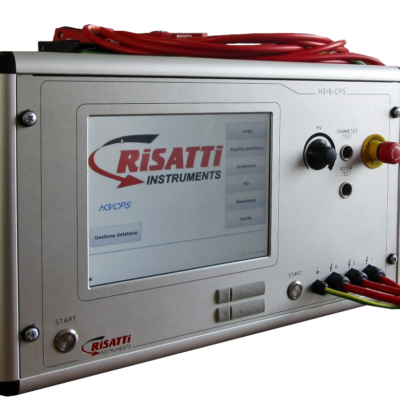
- Sensor, HARDWARE, current transformer, I/V converter and buffer. System bandwidth from 10khz to 20 Mhz, +-5db. 50 ohm output impedance. PICOSCOPE 2407B digitizer.
- SW driver and its application: Programmable digital filter. Programmable acquisition parameters, memorized preset possible. Adjustable net acquisition time. Calculation of the measured charge, with peak storage. Synchronization of the sampling activity with the power supply time, calculation of the detection start voltage (PDIV).

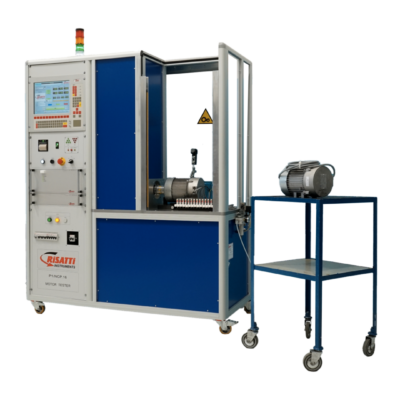
The system is designed to be used on machines intended bot for production, without PDIV acquisition and supply of the measured charge data, both on laboratory machines capable of measuring PDIV and providing dispersion diagrams as a function of the applied voltage and charge level.
Software of partial discharge detector
The sampler captures the signal and creates a buffer of length proportional to the actual scanning time. This time can be set with a millisecond resolution: it is advisable to set it over 100 ms.
Given the selected sampling frequency, it is possible to set a digital filter of the acquired signal: in the 125MS sampling image, a calibrated band-pass filter from 100khz up to 60 MHz has been chosen.
The PD Graph displays the current acquisition with the value of the measured charge in Coulomb: the charge is calculated with the integral of the current value over time, setting the polarity change of the input signal as limit.
It is therefore necessary that any component in DC is rejected, as well as any alternating residuals (in case of rigidity voltage testing): this is provided by the nature of the sensor itself which is a HW filter, and the software filtering.
The graph on the right shows the acquisition trend as a function of the applied voltage. Note: in this display, the trigger voltage (PDIV) is immediately deductible.

Acquisition on 20 ms with applied voltage of 1000 V, 1400 Vp: note the absence of discharge phenomena (graph on the right). The testing piece is a calibrated sample provided by the Customer.

Same conditions, but with applied voltage of 1500Vrms: as expected from the nature of the sample, the discharge phenomena are well evident and circumscribed between 1000 and 2300 Vp.
The two graphs on the left: PD graph, similar to the oscilloscope track, but with the charge value. Historic report at the bottom.
Finally, the indicators are the totalizers, charge on the negative, on the positive and peak (useful value in reference to its legislation): in this case we moved from 20 nC, practically residual charge, to about 100 nC in the second case.